
An expense-platform pilot is not a product demo. It is a controlled test of whether a new operating model can handle real employees, real approval behavior, real policy exceptions, real accounting handoffs, and real reimbursement deadlines before the organization multiplies volume across more countries or business units.
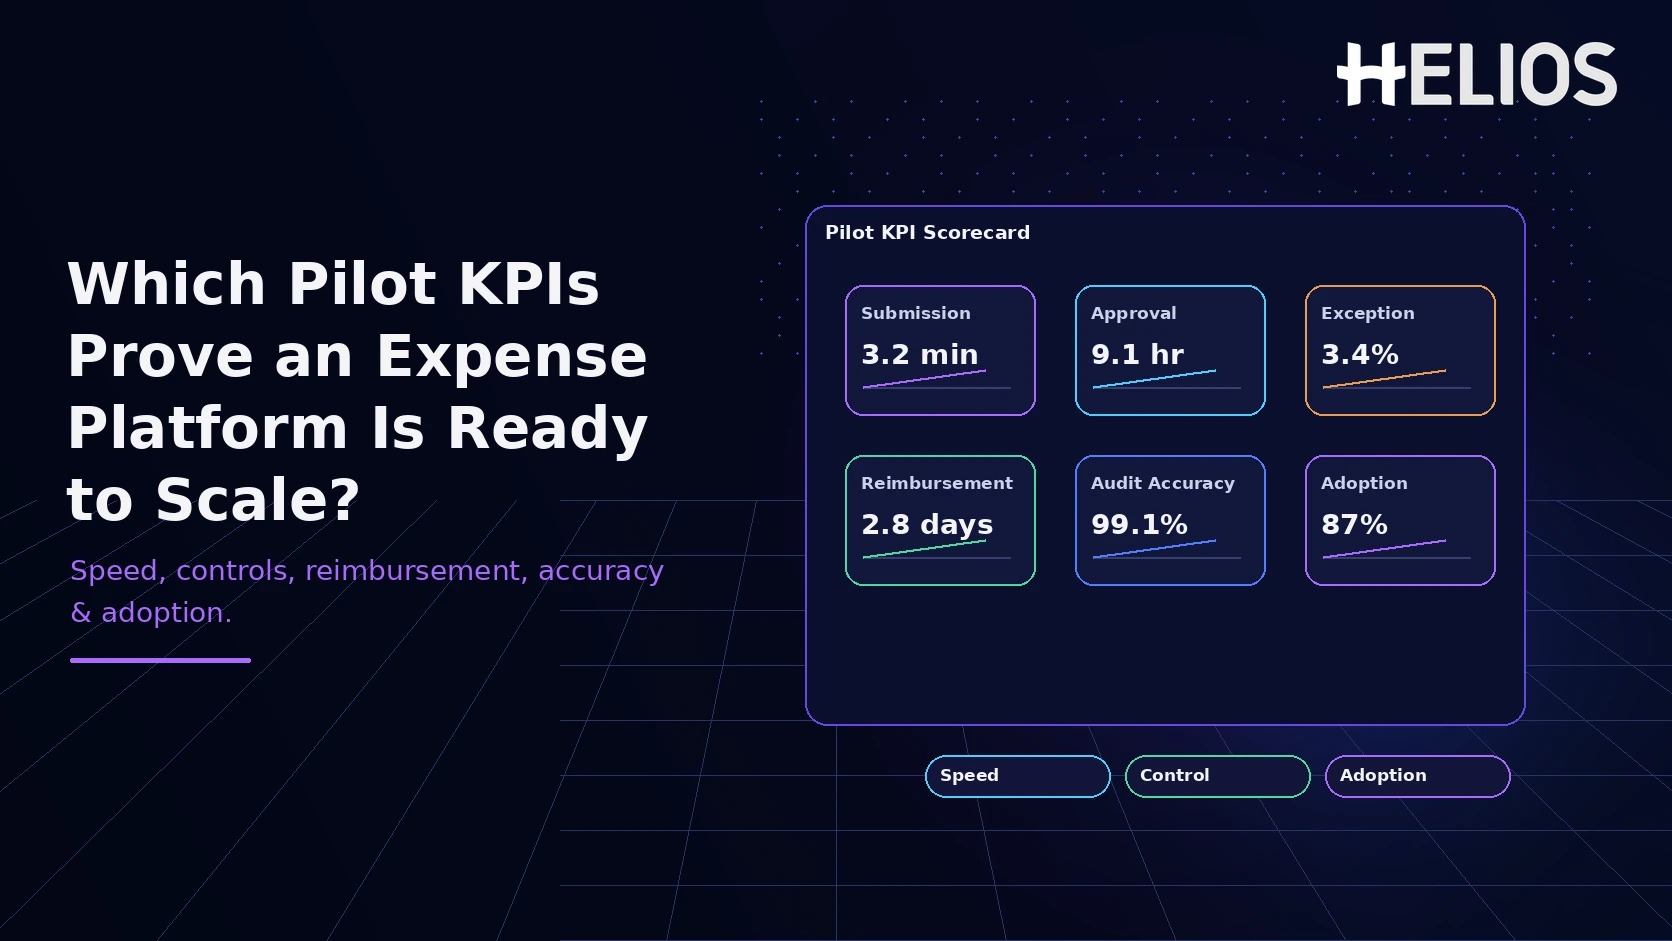
That is why no single KPI can prove scale readiness. Submission time reveals front-end friction. Approval time exposes routing and manager bottlenecks. Exception rate shows whether data and policy logic are creating hidden manual work. Reimbursement cycle measures the outcome employees actually feel. Audit accuracy protects control quality. Adoption proves that people use the intended workflow rather than bypassing it.
The strongest decision is therefore based on a balanced scorecard: use audit accuracy as a control gate, reimbursement cycle as the clearest end-to-end outcome, exception rate as a quality-and-workload signal, adoption as proof of real-world fit, and submission plus approval time as leading indicators of where the workflow is gaining or losing speed.
The Six Pilot KPIs Answer Different Scale-Readiness Questions
A useful pilot scorecard separates user experience, throughput, control quality, end-to-end performance, and adoption instead of averaging everything into one headline number. The table below summarizes the role of each KPI.
| KPI | What it measures | Why it matters for scale | Primary role |
| Submission time | Time from starting a report or claim to complete submission | Reveals employee friction, data-entry burden, receipt-capture quality, and process clarity | Leading indicator |
| Approval time | Elapsed time from submission to final approval | Shows workflow efficiency, routing quality, approver capacity, and queue risk | Leading / throughput |
| Exception rate | Share of reports or line items requiring manual exception handling or correction | Indicates policy fit, data quality, and the amount of hidden manual work created | Quality / workload |
| Reimbursement cycle | Elapsed time from employee submission to confirmed reimbursement | Captures the end-to-end employee outcome across workflow, accounting, and payment | End-to-end outcome |
| Audit accuracy | Accuracy of policy, coding, duplicate, anomaly, or audit decisions against a validated sample | Protects control quality while the platform is optimized for speed and automation | Control gate |
| Adoption | Share of eligible users and eligible expense volume using the intended workflow | Proves the process works outside the project team and limits off-system workarounds | Scale validation |
1. Submission Time: Measure Friction, Not Just Form Speed
Submission time is the time an employee needs to turn an expense into a complete, valid claim. It is an important leading indicator because every extra field, receipt correction, category question, or policy ambiguity adds friction before an approver even sees the expense.
For a serious pilot, measure both the median and a tail metric such as P90. The median describes the typical experience; P90 exposes the long tail among first-time users, travelers, mobile users, or countries with more complicated documentation. Also track abandonment and return-to-employee loops so a fast initial submission does not simply shift work downstream.
- Recommended definition. Start timestamp to successful submission of a complete report or claim.
- Useful segments. Device, country, employee type, receipt type, expense category, and first-time versus repeat users.
- Scale warning. Submission time improves, but corrections, support tickets, or abandoned reports rise.
2. Approval Time: Watch the Long Tail, Not Only the Average
Approval time shows how quickly a submitted expense moves through required review. The common mistake is to report one global average. Approval behavior is usually skewed: most claims can move quickly while a smaller set waits days because of routing errors, unclear policy, delegated approvals, or overloaded managers.
A better pilot view reports median, P90, and aged backlog. Where the data allows it, separate employee correction time from approver waiting time. A claim waiting for a missing receipt is a different problem from a clean claim sitting untouched in a manager queue.
- Measure. Submission-to-final-approval elapsed time, plus backlog aging and escalation/reassignment rates.
- Segment. Approver role, country, department, approval step, exception status, and amount band.
- Scale warning. The average improves while P90, aged backlog, or one approval group continues to worsen.
3. Exception Rate: Lower Is Good Only When Controls Still Work
Exception rate is often treated as a simple "lower is better" KPI. That can be misleading. A high rate may indicate confusing policy, weak receipt data, inaccurate categories, broken integrations, or immature configuration. But an exception rate that suddenly approaches zero can also be a warning if the team relaxed controls to make the pilot look smoother.
Define exceptions by type and severity before the pilot begins. Separate avoidable process exceptions — missing fields, invalid coding, routing errors — from genuine control exceptions such as policy violations or suspicious transactions. The goal is to reduce noise without reducing detection.
- Primary calculation. Claims or line items with at least one defined exception divided by total claims or line items in scope.
- Root-cause categories. Data quality, policy, receipt, coding, integration, routing, duplicate/fraud signal, and system error.
- Scale warning. The rate falls only after thresholds are widened, policy rules are disabled, or manual work moves to finance.
4. Reimbursement Cycle: The Clearest End-to-End Outcome
Reimbursement cycle is usually the strongest single business-outcome KPI because it crosses organizational boundaries. A claim can be easy to submit and quick to approve yet still sit in accounting, payment preparation, bank processing, or an exception queue. Employees experience the entire chain, not the individual handoffs.
Use one primary definition for executive reporting — typically employee submission to confirmed reimbursement — and then decompose the cycle into approval, finance processing, accounting, and payment stages. That prevents one function from improving its own step while the employee's total wait remains unchanged.
- Report. Median and P90 reimbursement cycle, plus the share of claims paid within the company reimbursement SLA.
- Segment. Country, entity, currency, payment method, exception status, and expense type.
- Scale warning. Front-end KPIs improve while approved claims accumulate in accounting or payment queues.
5. Audit Accuracy: The Non-Negotiable Control Gate
Audit accuracy is different from audit coverage. Coverage answers how many expenses were checked. Accuracy asks whether policy, coding, duplicate, anomaly, or audit decisions were correct. In an AI-assisted or rules-driven process, the pilot must show that automation does not create unacceptable false negatives, false positives, or inconsistent policy outcomes.
Use a validated sample and compare system or AI decisions with an agreed reference review. For higher-risk controls, track false negatives separately because missing a real violation can matter more than creating an extra review. For lower-risk controls, false positives matter because they create avoidable finance effort and employee frustration.
- Validate both clean and flagged claims. A sample made only of obvious exceptions will overstate accuracy.
- Use stricter gates for critical controls. Duplicates, prohibited categories, tax evidence, and high-value approval rules should not be traded for faster cycle time.
- Scale warning. Critical misses remain unresolved or the validation sample is too small or biased to support a conclusion.
6. Adoption: Prove That Users Choose the Intended Workflow
Adoption is easy to measure badly. Login counts are not enough. An employee can sign in once, fail to complete a report, and return to email, spreadsheets, or the legacy tool. The relevant question is whether eligible employees and approvers complete real work through the new platform.
Measure both user adoption and volume adoption. A pilot can look successful if headquarters users participate heavily while infrequent travelers, mobile employees, local finance teams, or approvers quietly bypass the process. Those gaps become expensive when the rollout expands.
- Employee adoption. Share of eligible users completing at least one relevant end-to-end transaction during the measurement window.
- Volume adoption. Share of eligible claims or spend that actually flows through the new platform.
- Experience signal. Support tickets, repeat training demand, abandonment, and off-system workarounds should decline as adoption improves.
Which KPI Matters Most?
The six KPIs answer different questions, so ranking them by role is more useful than forcing them into a single score.
- Audit accuracy is the guardrail. If material policy or audit decisions are unreliable, the platform is not ready to scale no matter how fast it feels.
- Reimbursement cycle is the end-to-end outcome. It proves whether employees actually get paid on time across approval, accounting, and payment.
- Exception rate reveals hidden workload. It shows whether automation is reducing manual effort or merely moving it to finance and support teams.
- Adoption validates real-world fit. Scale is risky when employees or approvers need workarounds to finish ordinary tasks.
- Approval time diagnoses workflow bottlenecks. It shows whether routing and management behavior can keep pace as volume rises.
- Submission time diagnoses front-end friction. It is an early signal of usability, receipt-capture quality, and policy clarity.
A practical go/no-go rule is stronger than choosing one KPI: require the control gate to pass, require reimbursement performance to meet the organization's SLA, and then confirm that exception, adoption, submission, and approval trends remain stable or improve as pilot volume rises.
Set Pilot Targets From Your Baseline and Risk Tolerance
Universal benchmarks are tempting, but they are rarely defensible across multinationals. Expense complexity varies by policy, country, tax documentation, payment model, approval design, user mix, and legacy process. The better approach is to agree targets before results are known using baseline-relative improvement plus absolute business-service and control gates.
| KPI | Scale-ready evidence | Hold or investigate when |
| Submission time | Median and P90 improve and remain stable across key user segments | Long tail stays high, abandonment rises, or corrections shift downstream |
| Approval time | Backlog and P90 improve as pilot volume increases | Average improves but aged backlog or specific approval steps worsen |
| Exception rate | Avoidable exceptions decline while true policy violations remain detectable | Rate stays high or becomes suspiciously low after controls are relaxed |
| Reimbursement cycle | Submission-to-payment cycle meets or improves the internal reimbursement SLA | Approval is fast but accounting, payment, or entity handoffs create a queue |
| Audit accuracy | Validated samples meet the agreed quality threshold with no critical misses | False negatives, inconsistent decisions, or weak sampling make the result unreliable |
| Adoption | Eligible users and eligible volume use the intended workflow without material workarounds | Logins are high but transaction completion, volume coverage, or local participation is weak |
How Helios Can Support a Pilot That Is Designed to Scale
Helios's receipt capture, policy control, approvals, accounting automation, and analytics map naturally to the six KPIs above when the measurement design is defined before launch. Three touchpoints matter most:
- AI-Powered Receipt Capture and **Claim Copilot** reduce submission friction. Receipt OCR auto-fills invoice details, while conversational claim creation reduces repeated entry. In a pilot, the evidence should appear in lower submission time, fewer missing-field corrections, and stronger completion rates.
- Flexible Approval Workflows and Approval Copilot reduce approval queues. Configurable routing by department, role, or cost center and AI-assisted policy review can be tested through first-pass routing accuracy, P90 approval time, backlog aging, and return-to-employee rates.
- Intelligent Analytics & Reporting makes the scale decision evidence-based. Dashboards and customizable reports let leaders inspect KPI trends, distributions, outliers, and segment differences instead of relying on one global average.
Automated Policy Control and Seamless Accounting Integration matter too — the former should reduce avoidable exceptions without weakening detection of genuine policy violations, and the latter should keep the reimbursement cycle predictable by moving approved claims cleanly into accounting and payment — but proving those two is really about watching KPIs 3 and 4 above, not a separate pilot workstream.
Helios's website discloses reference figures for these same outcomes: 75% faster employee reimbursement, 60% more efficient accounting and payment processing, 65% less time spent on finance review, and 100% digital expense-category control. Treat these as the vendor's own disclosed figures, not a guarantee for every organization — the pilot's job is to measure your own baseline against the same submission-time, approval-time, exception-rate, reimbursement-cycle, audit-accuracy, and adoption categories defined above, then confirm whether your results move in the same direction before committing to scale.
Related Helios pages: Helios platform | Spark AI | Helios Resources
A Simple Pilot-to-Scale Measurement Process
- Define the KPI contract before the pilot. Agree definitions, timestamps, data sources, segmentation rules, reimbursement SLA references, audit sampling, and explicit pass/watch/stop conditions.
- Capture a credible baseline. Measure the current expense process using the same definitions. If the legacy environment cannot provide perfect timestamps, document the limitation rather than inventing precision.
- Choose a representative pilot cohort. Include enough complexity to test employee types, approvers, expense categories, mobile usage, policy exceptions, accounting outputs, and meaningful local variations.
- Instrument the end-to-end journey. Capture states from expense creation through reimbursement. Keep rejected, abandoned, returned, and off-system transactions visible rather than silently removing them from the denominator.
- Run for multiple complete expense cycles. The pilot should continue long enough for claims to reach approval, accounting, payment, and audit. A pilot that ends at approval cannot prove reimbursement readiness.
- Review root causes every week. Investigate slow approvals, common exception types, false positives, support tickets, and adoption gaps. Fix configuration or process problems and confirm the trend improves.
- Stress edge cases before scale. Test delegated approvals, missing receipts, multi-currency claims, policy exceptions, card mismatches, accounting failures, and representative country scenarios.
- Hold a formal scale-readiness review. Bring finance, IT, control/audit, payment owners, local representatives, and the vendor together. Scale only when KPI evidence, unresolved risks, support readiness, and operating ownership are clear.
Red Flags That Mean the Platform Is Not Ready to Scale Yet
- Submission time improves, but return-to-employee corrections, abandonment, or support tickets rise sharply.
- Approval averages look healthy, but P90 aging or one approver group creates a persistent backlog.
- Exception rate falls only because policies were disabled, tolerances widened, or manual handling moved downstream.
- Reimbursement becomes slower even though the front-end workflow is faster, indicating accounting or payment handoff problems.
- Audit accuracy rests on a small or biased sample, or critical false negatives remain unresolved.
- Adoption looks high by login count while eligible expense volume still flows through spreadsheets, email, or the legacy tool.
- The pilot depends on heavy manual intervention that cannot be repeated when volume grows materially.
FAQ
Should a pilot have one overall readiness score? A composite score can help executives scan the program, but it should never hide control failures. Keep the six underlying KPIs visible and make audit accuracy, severe defects, and reimbursement continuity explicit gates that cannot be averaged away.
How long should an expense-platform pilot run? Long enough to cover multiple complete expense and reimbursement cycles, normal approver behavior, representative exceptions, and at least one realistic volume peak. The right duration depends on claim frequency, payment cadence, and operating complexity.
What if submission time improves but exception rate rises? Treat it as a quality warning. The front end may be faster because required information is being skipped or classification is less accurate. Review the exception taxonomy, receipt and coding quality, policy configuration, and correction loops before scaling.
What if adoption is high but reimbursement is slow? High adoption proves demand, not end-to-end readiness. Break the reimbursement cycle into approval, finance processing, accounting, payment, and exception stages, then fix the bottleneck before adding volume.
Prove Repeatable Performance Before You Multiply Volume
The best pilot KPIs do more than show that an expense platform works. They show whether performance remains fast, accurate, controlled, and usable when real employees, approvers, finance teams, and downstream systems interact with it.
Submission time and approval time are leading indicators. Exception rate reveals hidden operational friction. Reimbursement cycle captures the end-to-end employee outcome. Audit accuracy prevents the organization from trading control for speed. Adoption proves that the process fits real behavior. Read together, these six metrics create a much stronger scale decision than any single number.
For enterprises evaluating Helios, define the scorecard before the pilot, measure complete workflows, segment the results, and expand only when performance is repeatable.