
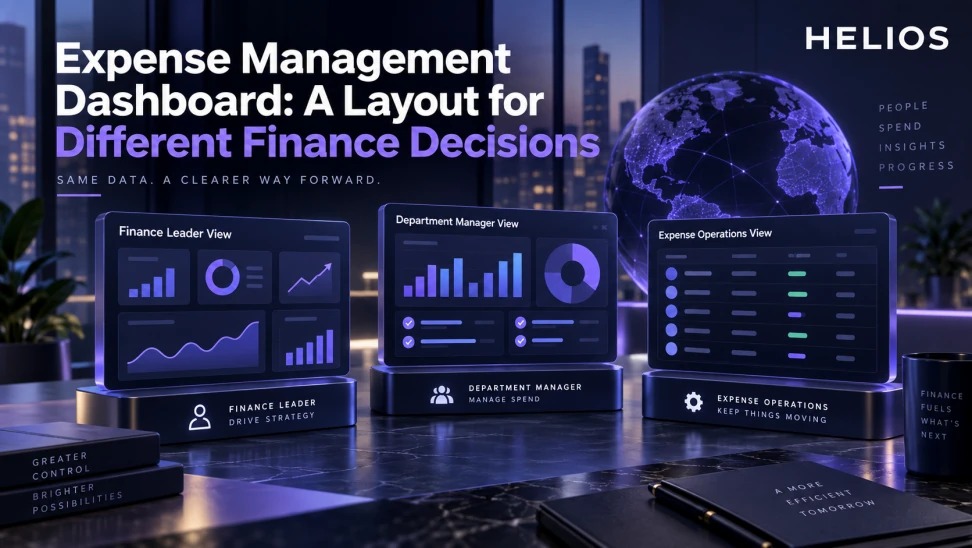
A role-based expense management dashboard layout for finance leaders, department managers, and expense operations teams.
A practical framework for finance teams
A role-based expense management dashboard layout for finance leaders, department managers, and expense operations teams.
A dashboard should not mix every available metric on one screen. Definitions, denominators, date bases, currencies, scope, refresh time, and data limitations must be visible before users compare results.
For related guidance, see automated expense tracking.
A useful design starts with the decision, then specifies the data, owner, control, timing, and next action. This keeps dashboards, forms, queues, verification, and approvals connected to the work finance must complete.
Expense Management Dashboard at a glance
| Audience | Primary decision | Top measures | Drill-down |
| Finance leader | Where to intervene | Spend, budget variance, risk, close status | Entity and trend |
| Department manager | What to approve or change | Budget, category, exceptions, aging | Employee and project |
| Expense operations | What to resolve now | Queue, returns, SLA, failures | Claim and owner |
| Accounting | What blocks close | Export, posting, reconciliation | Batch and transaction |
For related guidance, see expense platform pilot KPIs.
A clear workflow connects the trigger, evidence, owner, decision, and follow-up.
Start with three dashboard views
The finance-leader view should show material spend movements, budget variance, unresolved risk, reimbursement exposure, and accounting readiness. The department-manager view should show owned spend, approvals, exceptions, and project or cost-center detail.
The expense-operations view should prioritize work queues, returned claims, missing evidence, integration failures, and aging. Use one governed metric dictionary across all views.
For related guidance, see expense automation reporting.
Design the finance-leader path
Begin with total in-scope spend, period change, budget variance, category and entity mix, policy exceptions, and close status. Let the user move from enterprise trend to entity, category, owner, and underlying records.
Display absolute value and rate together. Explain whether dates are transaction, approval, posting, or payment dates and how currencies are converted.
Design the department-manager path
Show budget consumed, forecast or commitment context where available, pending approvals, older claims, exception reasons, category mix, and project or client allocation.
The next action should be obvious: approve, return, explain variance, review an exception pattern, or contact finance. Restrict access to the manager’s authorized population.
Design the expense-operations path
Use an actionable queue with status, age, amount, employee, entity, issue type, owner, due time, and next step. Separate incomplete claims, policy exceptions, approval delays, reimbursement failures, and accounting errors.
Rank by materiality, employee impact, close risk, and service target. Averages alone can hide a small group of very old items.
For related guidance, see expense categories and GL accounts.
Define metrics and filters
For each tile document formula, numerator, denominator, population, period, currency, exclusions, refresh time, threshold, and owner. Provide filters for entity, department, project, category, user, merchant, currency, and status.
Preserve filter context when drilling into records. Clearly label incomplete data and do not compare teams with materially different scopes without explanation.
Connect every insight to action
A dashboard should link an exception to its reviewer, an aging item to its queue, a variance to its budget owner, and a posting failure to its recovery process.
Measure use through resolved items and better outcomes, not page views alone. Review unused tiles and recurring manual exports.
How Helios supports this workflow
Helios can connect mobile expense capture, multilingual OCR, configurable policy controls, role-based approvals, accounting preparation, integration, and multidimensional reporting. Spark AI can assist in confirmed conversational and policy-review scenarios. Exact delegation, reminder, transfer, risk-scoring, conflict detection, algorithm, and integration behavior should be validated during implementation.
For related guidance, see finance automation for expense management.
- Provide multidimensional reporting for expense decisions.
- Show workflow, policy, approval, and accounting status.
- Support analysis by entity, category, department, project, user, and currency.
- Connect summary metrics to underlying expense records.
- Use role-based access for different audiences.
- Export governed data for broader finance reporting.
A practical conclusion
Design around the decision and the accountable person. Make evidence easy to find, exceptions visible, and next actions explicit. Measure whether the workflow improves control, speed, and employee experience.
See how Helios can support this workflow. Request a Helios demo.
FAQ
What should an expense management dashboard show?
It should show the measures and queues needed for a specific finance decision, with definitions, owners, and drill-downs.
Should every user see the same dashboard?
No. Finance leaders, managers, operations, and accounting teams need different decisions and levels of detail.
Which metrics belong on the executive view?
Common choices include spend, budget variance, category and entity mix, material exceptions, reimbursement exposure, and close status.
What should an operations dashboard prioritize?
Prioritize unresolved work by status, age, amount, employee impact, close risk, owner, and next action.
How should dashboard metrics be defined?
State formula, denominator, population, period, currency, exclusions, refresh time, threshold, and owner.
How can Helios help?
Helios provides multidimensional reporting, workflow status, policy context, integrations, and underlying expense records.