
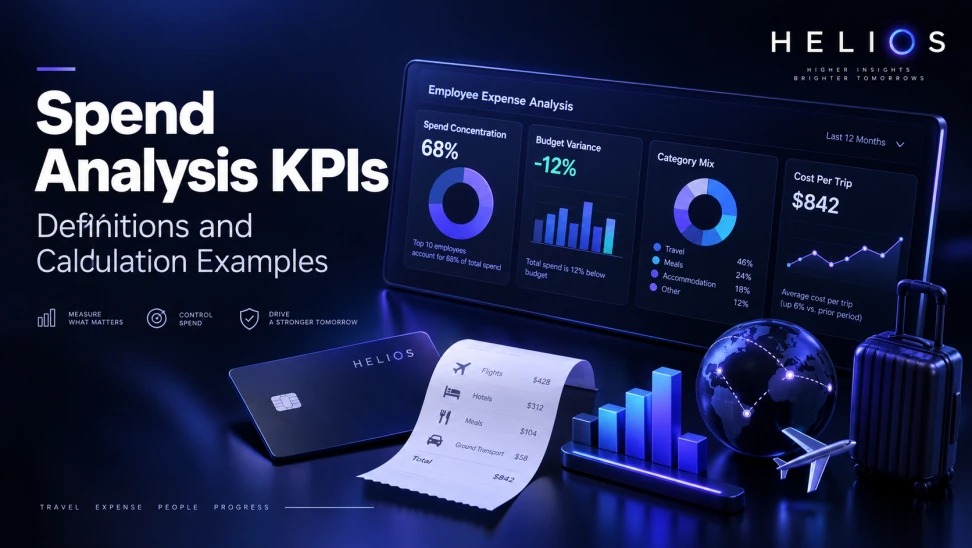
A formula-based guide to spend analysis KPIs for employee expenses, with denominators, comparison rules, actions, and data limitations.
A practical framework for finance teams
A formula-based guide to spend analysis KPIs for employee expenses, with denominators, comparison rules, actions, and data limitations.
KPI values are comparable only when scope, date basis, currency treatment, category mapping, employee population, and data channels are consistent. Benchmarks without these definitions can mislead.
For related guidance, see expense platform pilot KPIs.
A useful approach starts with definitions, data boundaries, accountable owners, and measures that can change a decision. The following framework keeps the analysis comparable while connecting it to day-to-day expense operations.
Spend Analysis KPIs for Employee Expenses at a glance
| KPI | Formula | Decision use | Key limitation |
| Spend concentration | Top-N segment spend / total spend | Focus control or sourcing | Depends on segment and N |
| Budget variance | (Actual − budget) / budget | Investigate overspend | Budget revisions matter |
| Category mix | Category spend / total spend | Understand cost structure | Taxonomy drift |
| Cost per trip | Eligible trip expense / completed trips | Compare travel patterns | Trip definition |
| Exception rate | Exception claims / reviewed claims | Improve policy or behavior | Exception definition |
For related guidance, see automated expense tracking.
A decision-ready framework turns expense data into accountable action.
Start with a controlled dataset
Define employee-paid claims, corporate-card transactions, travel expenses, advances, refunds, direct payments, entities, period, date basis, and currencies. Reconcile included channels to control totals.
Preserve original amounts and use a documented conversion source and date for consolidated reporting. Version category and organizational mappings.
For related guidance, see expense automation reporting.
Measure spend concentration
Spend concentration = spend in the top N merchants, categories, teams, routes, or employees divided by total in-scope spend. State the dimension and N.
Use it to prioritize review or sourcing, but investigate business context before treating concentration as waste. Show transaction count and population as well as value.
Calculate budget variance
Budget variance amount = actual expense − budget. Budget variance percentage = (actual − budget) / budget × 100. Define whether actual means transaction, approved, or posted value.
Separate volume, price, mix, timing, and classification effects. Handle zero or missing budgets explicitly rather than reporting an infinite percentage.
Track category mix
Category mix percentage = category spend / total in-scope spend × 100. Compare consistent taxonomy versions and disclose reclassifications.
Pair mix with absolute value and transaction count. A rising share can occur because the category grew or because other categories fell.
For related guidance, see spend management and budget control.
Define cost per trip
Cost per trip = eligible travel expense / completed in-scope trips. Define trip start and end, cancellations, multi-city journeys, traveler count, and direct-paid costs.
Segment by route, region, duration, traveler role, and booking window. Avoid comparing materially different trip types.
Connect policy and process KPIs
Exception rate = exception claims / reviewed claims. Return rate = returned submissions / submitted claims. Cycle time should use a stated start, end, and percentile.
These measures explain how process quality affects spend visibility. They should not be combined into an opaque score without documented weighting.
Turn KPIs into actions
For each KPI assign threshold, owner, review cadence, drill-down, decision, and follow-up measure. Record whether a change affected cost, employee burden, compliance, or business outcomes.
Report data limitations beside the result: missing channels, late claims, unmatched refunds, small samples, currency effects, and category drift.
How Helios supports this workflow
Helios can connect mobile expense capture, multilingual OCR, configurable policy controls, role-based approvals, accounting preparation, integration, and multidimensional reporting. Spark AI can support conversational assistance and policy review within the confirmed product scope. Predictive modeling, autonomous execution, specific logs, and retention periods should be validated during solution design.
For related guidance, see expense categories and GL accounts.
- Capture structured expense and receipt data.
- Report by entity, category, project, department, employee, currency, and time.
- Track policy outcomes and workflow status.
- Connect approved expenses to accounting data.
- Support drill-down from summary measures to underlying records.
- Export data for governed KPI calculations and comparisons.
A practical conclusion
The best result is a repeatable operating model: define the question, preserve the evidence, assign the decision, measure the outcome, and improve the policy or workflow when the data supports a change.
See how Helios can support this workflow. Request a Helios demo.
FAQ
What are spend analysis KPIs?
They are defined measures of spend structure, budget performance, travel cost, policy outcomes, and process quality.
How is spend concentration calculated?
Divide spend in a stated top-N segment by total in-scope spend and disclose the segment, N, period, and population.
How is budget variance calculated?
Subtract budget from actual for the amount; divide that difference by budget and multiply by 100 for the percentage.
What is a useful travel expense KPI?
Cost per completed trip is useful when trip boundaries, travelers, direct-paid costs, currency, route, and duration are consistent.
Why can KPI comparisons be misleading?
Different scopes, dates, currencies, taxonomy versions, channels, or denominators can create false differences.
How can Helios support KPI reporting?
Helios can provide structured, multidimensional expense and workflow data; finance owns definitions, baselines, and decisions.